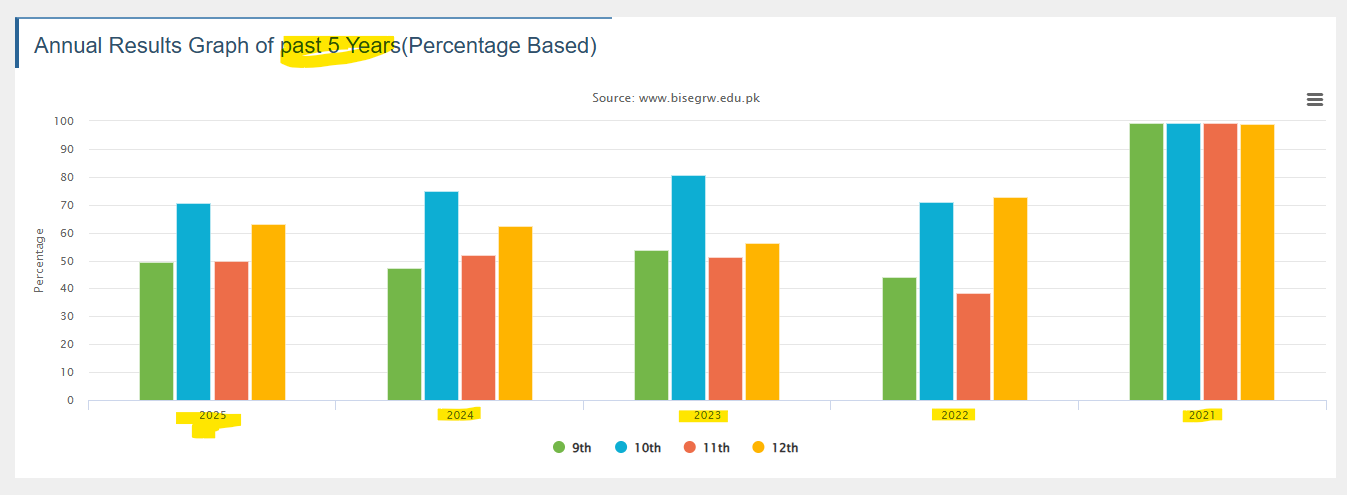
Understanding educational trends requires a close look at historical metrics. For students, educators, and researchers under the Board of Intermediate and Secondary Education (BISE) Gujranwala, evaluating performance trends provides essential context for academic planning. This detailed review examines the percentage-based annual results graph spanning the past five years (2021 to 2025), sourced directly from official board data (www.bisegrw.edu.pk).
The annual performance metrics tracking 9th, 10th, 11th, and 12th classes reveal notable shifts in passing percentages. Education standards, policy adjustments, and curriculum modifications all play a role in shaping these yearly outcomes. Analyzing these changes helps stakeholders understand how student success rates fluctuate across secondary and higher secondary levels.
Year-by-Year Statistical Breakdown (2021–2025)
A granular review of the data highlights significant milestones and variances in pass percentages across different grades over the five-year window:
2021 Academic Year: This year recorded exceptionally high pass percentages across all classes, with 9th, 10th, 11th, and 12th grades all hovering near or at peak levels (9th: 99.37%, 10th: 99.27%, 11th: 99.35%, and 12th: 98.81%), largely influenced by special pandemic-era grading policies.
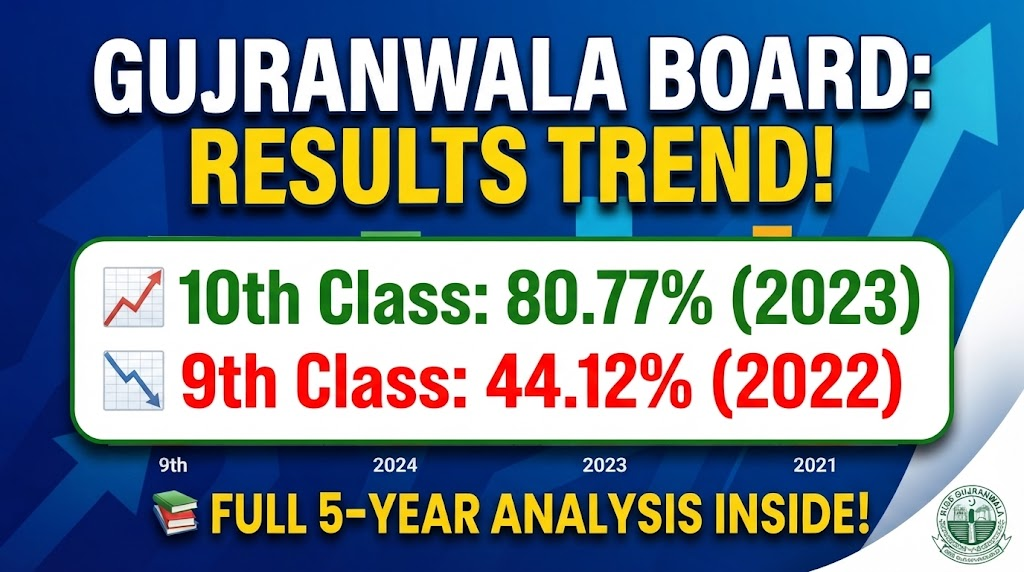
2022 Academic Year: Post-pandemic normalization led to a sharp realignment in standards. The 10th class maintained a strong 70.87% pass rate, and 12th grade stood at 72.93%, while 9th class recorded 44.12% and 11th class experienced a dip down to 38.48%.
2023 Academic Year: Performance rebounded in several categories. The 10th class reached a high point of 80.77%, 9th class stood at 53.72%, 11th class recorded 51.17%, and 12th class registered 56.11%.
2024 Academic Year: Results demonstrated steady stabilization. The 10th class maintained a solid 74.93% pass rate, 9th class recorded 47.38%, 11th class stood at 51.81%, and 12th class achieved 62.32%.
2025 Academic Year: The most recent cycle shows consistent performance metrics, with 10th class securing a 70.58% pass rate, 9th class at 49.37%, 11th class at 49.95%, and 12th class standing at 63.10%.
Secondary vs. Higher Secondary Consistency: Across the standard board cycles, 10th-grade passing percentages consistently outpace 9th-grade metrics, highlighting the stabilization of student preparation as they complete their secondary education.
Impact of Policy Shifts: The stark contrast between the 2021 metrics and subsequent years underscores how educational frameworks and assessment policies dictate overall outcome percentages.
Strategic Preparation: Recognizing these multi-year trends enables educators and students to target high-failure tiers—such as intermediate first-year classes—ensuring better resource allocation and focused study habits.
👇 کیا آپ کو BISE Gujranwala کے ان نتائج یا ڈیٹ شیٹ سے متعلق کوئی اور معلومات چاہیے؟ اپنا سوال نیچے کمنٹ باکس میں ضرور پوچھیں!